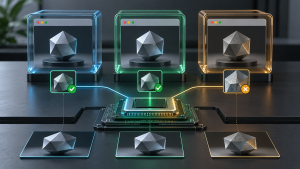

- 1 Why device memory and CPU core signals matter
- 2 Step 1: Record the expected hardware profile
- 3 Step 2: Compare values before and after handoff
- 4 Step 3: Check whether the values match the operating system story
- 5 Step 4: Review automation and virtual machine settings
- 6 Step 5: Compare hardware signals with Canvas and WebGL
- 7 Device memory and CPU-core review table
- 8 When to keep, repair, or pause a profile
- 9 Final checklist
Some browser profile problems do not start with cookies, proxies, or login pages. They start with a small hardware-related signal that no one checked before the profile was reused. Device memory and CPU core values are two of those signals. They are easy to overlook because they do not look as dramatic as an IP change, but they can still make an account environment feel inconsistent when the same profile moves between operators, machines, or automation contexts.
The goal is not to invent a perfect machine identity or chase every possible fingerprint value. The practical goal is simpler: before a profile is reused, confirm that its hardware-related signals still match the profile history, task type, and expected account environment. For teams using an antidetect browser, that check should happen before login, not after an account shows a warning.
Why device memory and CPU core signals matter
Modern browsers expose or imply several hardware-related values. Two common examples are device memory and hardware concurrency, which usually reflects a CPU-core or thread-count style signal. These values are not identity by themselves. They become useful when combined with other signals such as user agent, operating system, screen, WebGL, Canvas, time zone, language, storage, and proxy context.
| Signal | What it suggests | Why it can drift |
|---|---|---|
| Device memory | A coarse memory class for the browser environment | Profile moved to a machine or template with different defaults |
| CPU core / hardware concurrency | A coarse compute-capacity signal | Automation runtime, VM, container, or browser setting changed |
| Operating system | The platform the profile appears to run on | User agent and hardware values no longer fit each other |
| Canvas and WebGL | Graphics and rendering behavior | GPU, driver, browser build, or profile configuration changed |
| Time zone and language | Regional context | Proxy or profile metadata was changed without full review |
If you already run a broader browser fingerprint signals checklist, treat device memory and CPU cores as part of that review. They should not be checked alone, and they should not be ignored just because the IP looks correct.
Step 1: Record the expected hardware profile
Start by writing down the expected hardware profile before the account task begins. This does not need to be complicated. Record the profile owner, operating system family, browser version, device memory value, CPU-core or hardware-concurrency value, screen class, WebGL renderer pattern, and whether the profile is expected to run in a VM, local desktop, or automation environment.
This baseline prevents a common team mistake: one operator sees a value, another operator changes the environment, and nobody knows which value belongs to the account history. A simple profile record keeps the review grounded.
Step 2: Compare values before and after handoff
Handoffs are where hardware signals often drift. A profile may be exported, imported, reassigned, or opened on another workstation. Before anyone logs in, compare the current device memory and CPU-core values against the last known good run.
Use this quick rule: if the values changed, the team needs a reason. A planned change can be documented. An unexplained change should pause the login. This fits naturally with browser profile handoff validation, where proxy, fingerprint, and profile history are checked together.
Step 3: Check whether the values match the operating system story
A fingerprint becomes suspicious when its pieces tell different stories. Device memory and CPU-core values should make sense next to the user agent, operating system, browser version, screen, and graphics signals. For example, a profile that appears to be a modest mobile-like environment should not suddenly behave like a high-capacity desktop setup unless that change is intentional and documented.
You do not need to prove that a value is universally correct. You need to prove that it is consistent with the profile you are reusing. Consistency matters more than chasing a fashionable number.
Step 4: Review automation and virtual machine settings
Automation tools, virtual machines, and remote desktops can alter how hardware values appear. A profile opened through a local desktop may not expose the same signals as a profile started by an automation runner. If the account task depends on profile continuity, test from the exact execution path that will run the task.
| Execution path | What to verify | Stop condition |
|---|---|---|
| Local desktop | Device memory and CPU-core values match the profile record | Values changed after machine transfer without approval |
| Virtual machine | VM resources and browser values are stable between runs | VM template changes are not recorded |
| Automation runner | Runtime starts the intended profile and preserves expected values | Automation path shows different values than manual open |
| Team handoff | New operator sees the same core fingerprint story | Owner, device class, or hardware values are unclear |
If automation is involved, pair this review with browser profile automation checks. The profile should be verified from the same browser startup path that the task will actually use.
Step 5: Compare hardware signals with Canvas and WebGL
Device memory and CPU-core values are only part of the fingerprint story. Graphics signals can reveal a different kind of drift. If Canvas or WebGL behavior changes at the same time as hardware values, the profile may have moved across a browser build, graphics stack, driver, VM, or execution path.
That is why a Canvas fingerprint consistency checklist is useful before reusing profiles. Hardware signals, rendering signals, and account history should be reviewed as a group.
Device memory and CPU-core review table
| Check | Pass condition | Fail signal | Record field |
|---|---|---|---|
| Device memory | Matches last approved profile run | Value changed after handoff or template update | memory_value_before_login |
| CPU core signal | Matches expected hardware-concurrency range | Manual and automation paths show different values | cpu_core_value_before_login |
| OS and browser story | Hardware values fit user agent and browser version | Signals imply conflicting device classes | profile_story_check |
| Graphics signals | Canvas and WebGL remain consistent with profile history | Rendering changed without a known browser or driver update | graphics_signal_note |
| Team ownership | Operator, machine, and profile owner are clear | No one can explain who changed the environment | profile_owner_note |
When to keep, repair, or pause a profile
Keep the profile when hardware values, browser fingerprint signals, proxy context, and account history all match the expected record. Repair the profile record when the change is legitimate but not documented. Pause the profile when device memory or CPU-core values changed without a clear reason, especially before a sensitive login or team handoff.
This is also a good point to run a broader browser profile audit checklist. One hardware value rarely tells the whole story, but it can point to the exact place where a profile stopped matching its account environment.
Final checklist
- Record the expected device memory and CPU-core values before reuse.
- Compare manual, handoff, and automation startup paths.
- Check whether hardware signals fit the operating system and browser story.
- Review VM, remote desktop, and automation settings before login.
- Compare hardware values with Canvas, WebGL, time zone, language, and proxy context.
- Pause account work when hardware drift is unexplained.
Device memory and CPU-core checks are not magic fingerprint protection. They are operational guardrails. When teams document these values before reuse, they make browser profile consistency easier to review, easier to hand off, and easier to repair without guessing.